

Author: [email protected]
Data Source: SHIB Token Dashboard (Only data on Ethereum included)
Token analysis plays a pivotal role in the realm of cryptocurrency and digital assets. It is the process of delving deep into the data and market behaviors associated with these assets. It is a detailed process that involves thoroughly examining price and liquidity connected to these assets.
By analyzing tokens, we gain invaluable insights into market trends, risk factors, trading activities, and the direction of capital flows.
SHIB is the primary token in the Shiba ecosystem, representing a decentralized and community-driven cryptocurrency. It emerged in late 2020 and has quickly become a global sensation.
SHIB is now accepted as a valid payment method at numerous venues, either through direct transactions or via third-party services. The inclusion of governance features has elevated SHIB to a prestigious token, ranking it among the top 20 cryptocurrencies globally.
How to Analyze SHIB?
Token analysis is of paramount importance, and in this context, what are the key metrics to consider?

SHIB Price per Day for the Last 30 Days
Token Price Analysis: Understanding Market Cap and Price Fluctuations
As of January 22, 2024, the token’s price is approximately 0.00000927, which indicates a decrease of about 16.30% over the last month. Analyzing this price trend through diagnostic analytics provides insights into the token’s performance and potential predictive trends.
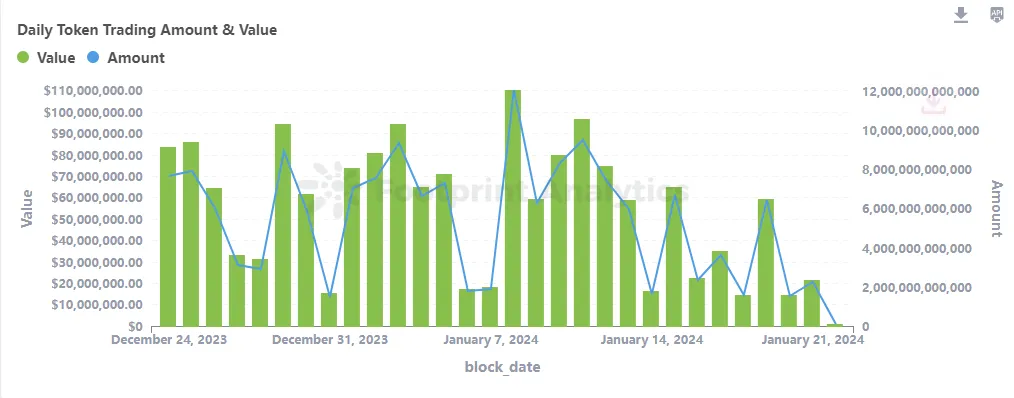
Picture: Daily Token Trading Amount & Value
Trading Value Insights: A Diagnostic Tool in Crypto Analytics
The token’s trading volume is currently around 17,879,696.93. Various data analytics reveal the dynamic nature of market activity and offer valuable insights into investor behavior and market sentiment.
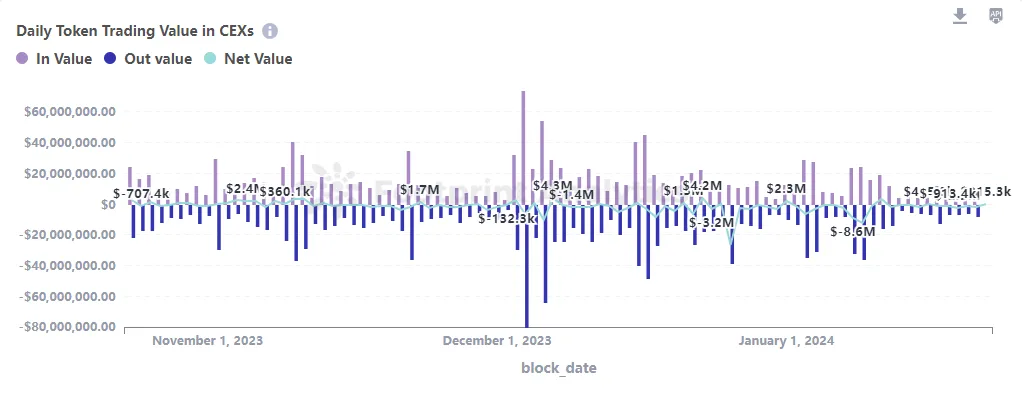
SHIB Daily Token Trading Value in CEXs
Net Flow Analysis in CEX: Identifying Trends in Investor Behavior
To gain a deeper understanding of investor behavior, it is essential to analyze the net flow of tokens in and out of centralized exchanges (CEXs). This analysis not only tracks the quantity of tokens moving into and out of exchanges but also examines the broader implications of these movements in relation to market trends, investor confidence, and liquidity.
In the context of SHIB recently, the dominant outflow trend could imply that investors are transferring tokens to private wallets, possibly as a strategy for long-term holding or due to concerns over the stability and security of exchanges.
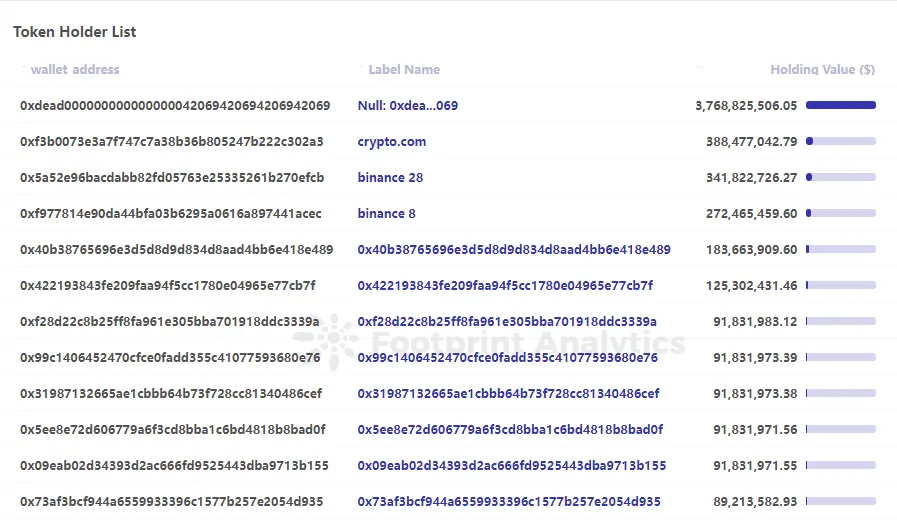
SHIB Token Holder List
Token Centralization: A Descriptive Analytics Approach
To understand market integrity and susceptibility to manipulation, it is crucial to evaluate token centralization. By analyzing the distribution of tokens among top holders, we can gain insights into the influence of whale investors and the overall health of the token market.
Footprint Analytics is a blockchain data solutions provider. It leverages cutting-edge AI technology to help analysts, builders, and investors turn blockchain data and combine Web2 data into insights with accessible visualization tools and a powerful multi-chain API across 30+ chains for NFTs, GameFi, and DeFi.
Product Highlights:
- Data API for developers.
- Footprint Growth Analytics (FGA) for GameFi projects.
- Batch download for big-size data fetch.
- View the data dictionary to explore all data sets Footprint provides.
- Check our X post (Footprint_Data) for more product updates.