
Another unicorn of web3 has shown itself this morning. The Block reported that Flashbots seeks up to $50 million at a billion-dollar valuation. It is definitely well-deserved due to its contribution to Ethereum. The existence and popularity of Flashbots Auction bring fierce competition to Sandwich searchers, thus crushing the profit of Sandwich chefs for a long time. Our data shows that, in the past 30 days, 82.5K sandwich MEVs created $845.5K profit out of a cost of $4.7M. The overall ROI is 18.1%.
As the most notorious MEV, Sandwich has always been known for its shady approaches. Being one of the best MEV data platforms in the industry, EigenPhi has provided an exclusive Sandwich module for Ethereum. The module displays real-time Sandwich attacks, as well as summary data, happening on Ethereum.
Although Flashbots has lessened the awful effect of Sandwich MEVs, the caused spillover has extended to the BSC chain. More and more Sandwich searchers moved to other chains, BSC Chain especially, on which none like Flashbots exists. Yet how bad was the situation? Nobody knew.
“If you can’t measure it, you can’t manage it.” Peter Drucker once said.
Today, we announce the first BSC Sandwich module of DeFi.
Similar to the one under ETH, the newly released BSC sandwich module includes Overview, Top 10 Exploited Contracts, Profit Distribution, Latest Attack,** and transaction, attacker, and** **victim leaderboards **over specific time periods.
With these data, we can answer the question: how dire the circumstance is on BSC?
Here is the 30-day data:
- Sandwich Count: 29,055
- Total profit for Sandwich attackers: $319,011.58
- Total cost: $44,271.02
- Attackers: 423
- Victims: 18135

Although the overall profit on BSC is about 37.8% of Ethereum, the cost is 100 times smaller, making the overall ROI 725%. And the attacker count, 423, is 2.5 times the number on Ethereum.
Let’s go through the BSC Sandwich module and see what else we can find.
Top 10 Exploited Contracts comes after the Summary section.

The chart tells us that 91.6%, which is 25,168 sandwich MEVs, happened on PancakeSwap Router V2.
Then there is the Profit Distribution chart. The one below shows that, out of the 29,055 sandwiches, 14,466 have a profit between $1 to $10. The average is $3.5 in this range.

Next, you can check out the latest Sandwiches happening on BSC.

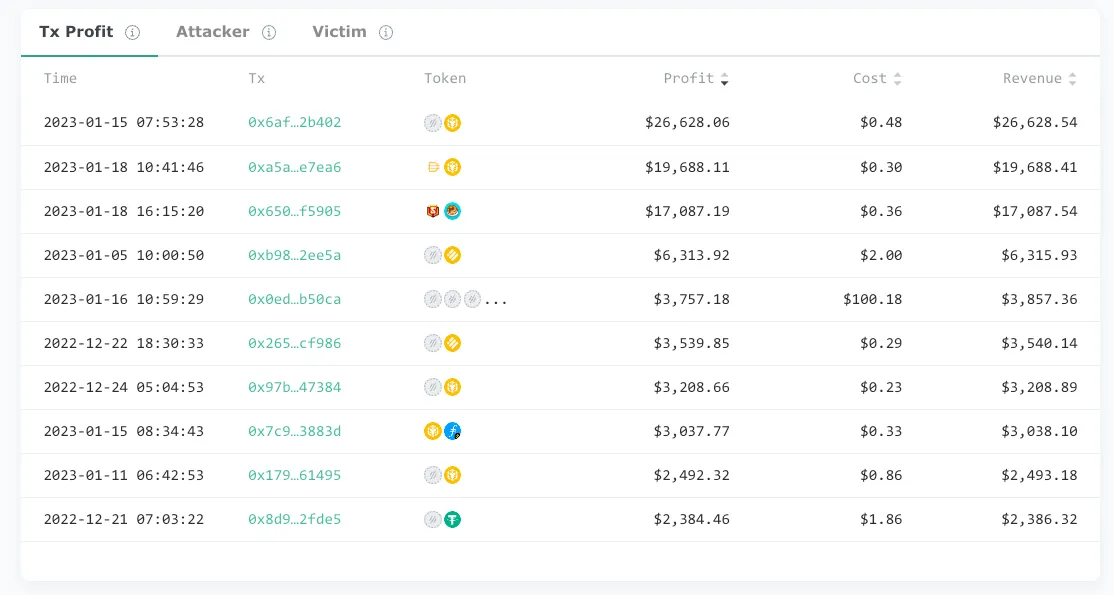
And you can check out the leaderboards about sandwiches, attackers, and victims. The first two are ranked by profit, while the last is picked based on their losses.


Wanna find out more details about one specific attacker or victim? You can click their addresses to view the data. Our user guide will guide you through the details of attackers and victims.
Of course, you can examine how a sandwich actually works by clicking the hash of it.
The detail page consists of mainly two parts: Summary and Token Flow Chart. The Summary section displays the profit, cost, and revenue of this sandwich. The Token Flow Chart section gives you detailed token flows happening in the format of a balance table. It reveals how tokens are traded among trading venues, i.e., liquidity pools, in three parts: FrontRun, Victim, and BackRun. Remember that sometimes you can many transactions fall victim to prey.

You can click the EigenTx button, marked below, to use the visualizer, which gives you a more intuitive graph about the process of the whole attack.

Here are the token flows of the previous sandwich.

That’s about it. DeFi’s first BSC Sandwich MEV module will show you many unexpected data that you would not be able to find anywhere else. Go check it out and tell us what you find!
Follow us via these to dig more hidden wisdom of DeFi: