
Author: [email protected]
Data Source: USDC Token Dashboard (Only data on Ethereum included)
Token analysis plays a pivotal role in the realm of cryptocurrency and digital assets. It is the process of delving deep into the data and market behaviors associated with these assets. It is a detailed process that involves thoroughly examining price and liquidity connected to these assets.
By analyzing tokens, we gain invaluable insights into market trends, risk factors, trading activities, and the direction of capital flows.
USD Coin (USDC) is a stablecoin backed by the full faith and credit of the United States dollar. It was launched in 2018 by Centre, a consortium established by fintech companies Circle and Coinbase. USDC has quickly gained prominence in the world of digital currencies due to its stability and security in the volatile world of cryptocurrencies.
USDC tokens are fully backed by U.S. dollars and dollar-denominated assets held in reserve. This ensures a 1:1 peg to the USD. USDC is one of the most transparent and trustworthy stablecoins available because for every USDC token in circulation, there is an equivalent amount of U.S. dollars held in reserve.
How to Analyze USDC?
Token analysis is of paramount importance, and in this context, what are the key metrics to consider?
Token Price Analysis: Understanding Market Cap and Price Fluctuations
USDC is designed to maintain a stable value with a 1:1 peg to the U.S. dollar. This is achieved through a reserve system, where for every USDC token in circulation, there is an equivalent amount of U.S. dollars held in reserve. This ensures that the price of USDC remains stable, making it an appealing choice for those who wish to avoid the price fluctuations typically associated with other cryptocurrencies such as Bitcoin or Ethereum.

USDC Daily Token Trading Amount & Value
Trading Value Insights: A Diagnostic Tool in Crypto Analytics
The volume of token trades is a key indicator of market activity. Currently, the token’s trading volume stands at $2.3B.

USDC Daily Token Trading Value in CEXs
Net Flow Analysis in CEX: Identifying Trends in Investor Behavior
To gain a deeper understanding of investor behavior, it is essential to analyze the net flow of tokens in and out of centralized exchanges (CEXs). There is a decrease in trading activity and investor interest as more USDC is leaving exchanges than entering them. This indicates that investors are holding tokens in personal wallets, which may suggest a lack of intent to sell. This could signal a cautious or bearish market sentiment, with investors waiting for better conditions or uncertain about the market’s immediate future.
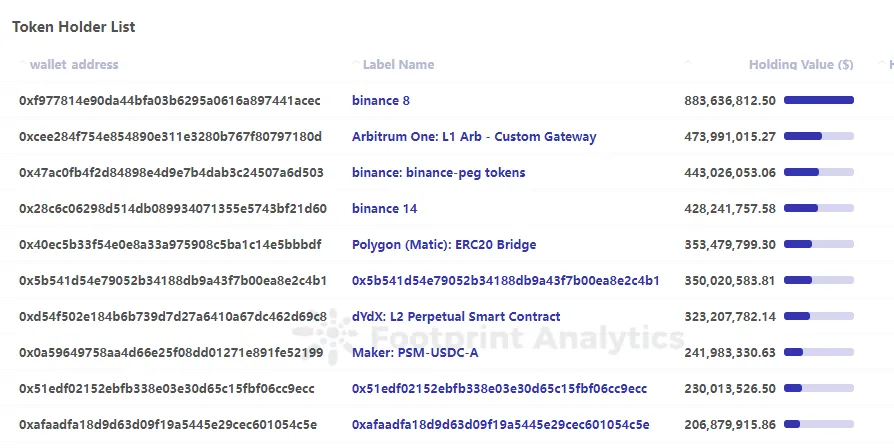
USDC Token Holder List
Token Centralization: A Descriptive Analytics Approach
To understand market integrity and susceptibility to manipulation, it is crucial to evaluate token centralization. By analyzing the distribution of tokens among top holders, we can gain insights into the influence of whale investors and the overall health of the token market.
Footprint Analytics is a blockchain data solutions provider. It leverages cutting-edge AI technology to help analysts, builders, and investors turn blockchain data and combine Web2 data into insights with accessible visualization tools and a powerful multi-chain API across 30+ chains for NFTs, GameFi, and DeFi.
Product Highlights:
-
Data API for developers.
-
Footprint Growth Analytics (FGA) for GameFi projects.
-
Batch download for big-size data fetch.
-
View the data dictionary to explore all data sets Footprint provides.
-
Check our X post (Footprint_Data) for more product updates.