Token Valuation Exercise with DYDX
Written by Earl Cho, Head of Financial Analyst @DeSpread
This article is solely informational and not a recommendation to invest in a specific asset or investment advice.
In the previous episode, we’ve looked at the implication and the methodology of valuation.
In this episode, we will perform valuation of token of DYDX, a decentralized exchange. For your note, making estimate, establishing the detailed logical structure of valuation, and entering numbers should be done based on your own perspective. Numbers that are not derived from your own thinking and calculation can’t be used as a basis of token holding. It only leads to panic buying when the chips are down. Therefore, please take this episode as an opportunity to learn from an example and to learn about making estimation and taking steps in performing valuation.
Absolute valuation
Let us begin with the absolution valuation model. In the current cryptocurrency market, the discounted cash flow (DCF) analysis is used to determine absolute value. It is about aggregating all present values of expected future cash flows using a discount rate.
The steps of DCF analysis are as follows.
• Estimating sales and earnings
• Determining the discount rate
• Calculating the terminal value
1. Estimating sales and earnings
DCF starts by estimating the sales and earnings of the analysis target and is also the most important input value. An artwork or an asset that relies entirely on narratives cannot be analyzed with the DCF method and must be analyzed using relative valuation.
Before making an estimation, let us look at the past data.
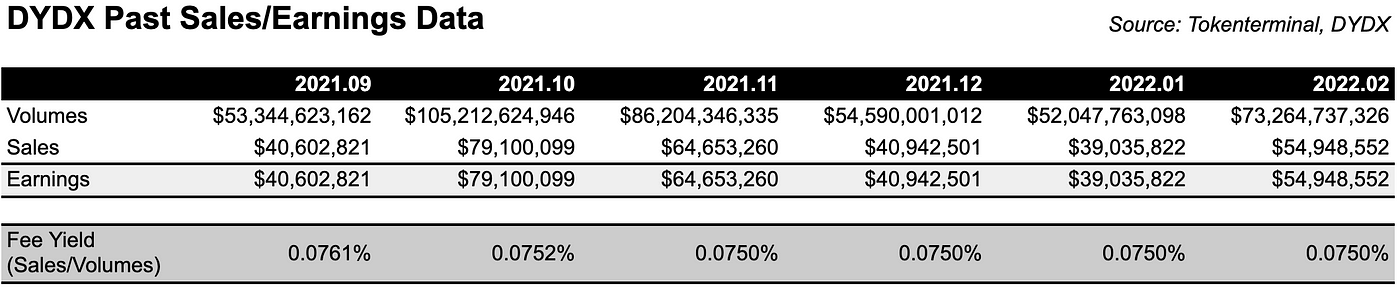
Looking at past data from token launch (Sept. 2021) to the present, you can see that the business model is very simple. (1) That DYDX’s sales is generated entirely from trading volume, (2) when a transaction occurs, a profit from the 0.075% fee is booked in sales, and that (3) there is no operating expenditure that the token holder must pay, and the sales are entirely attributed to the token holder (earnings).
The more complex the business model is, the more matters to consider and estimations based on assumptions, making it difficult to attempt valuation. We recommend that you start with these simple models.
In this episode, we will estimate sales using two approaches.
(1) Sales estimation framework 1
Let’s use the sales estimation method of Curve Finance Valuation introduced in the previous valuation 1 episode. Curve Finance’s sales are also a function of the volume on the relevant DEX, and we used the top-down approach as below to estimate the volume.
*- Total volume in DEX in 2021: 979B
- estimation period: 5 years (2022–2026)
- Curve Finance market share: 9% fixed rate
- Yield from the fee: 0.03% fixed rate*
• Bull scenario: volume growth by 300% in 2022 and the growth decrease by 2.5 times annually afterwards => A scenario where majority of volume is transitioned from CEX to DEX as the gas fees decreases after the successful launch of Ethereum 2.0
• Base scenario: volume growth by 200% in 2022 and the growth decrease by 2.5 times annually afterwards => DeFi grows consistently, and smart contract increases from L2, etc, leading to the volume growth
• Bear scenario: volume growth by 100% in 2022 and the growth decrease by 2.5 times annually afterwards => The market share is stolen by CEX with the crypto market pullback
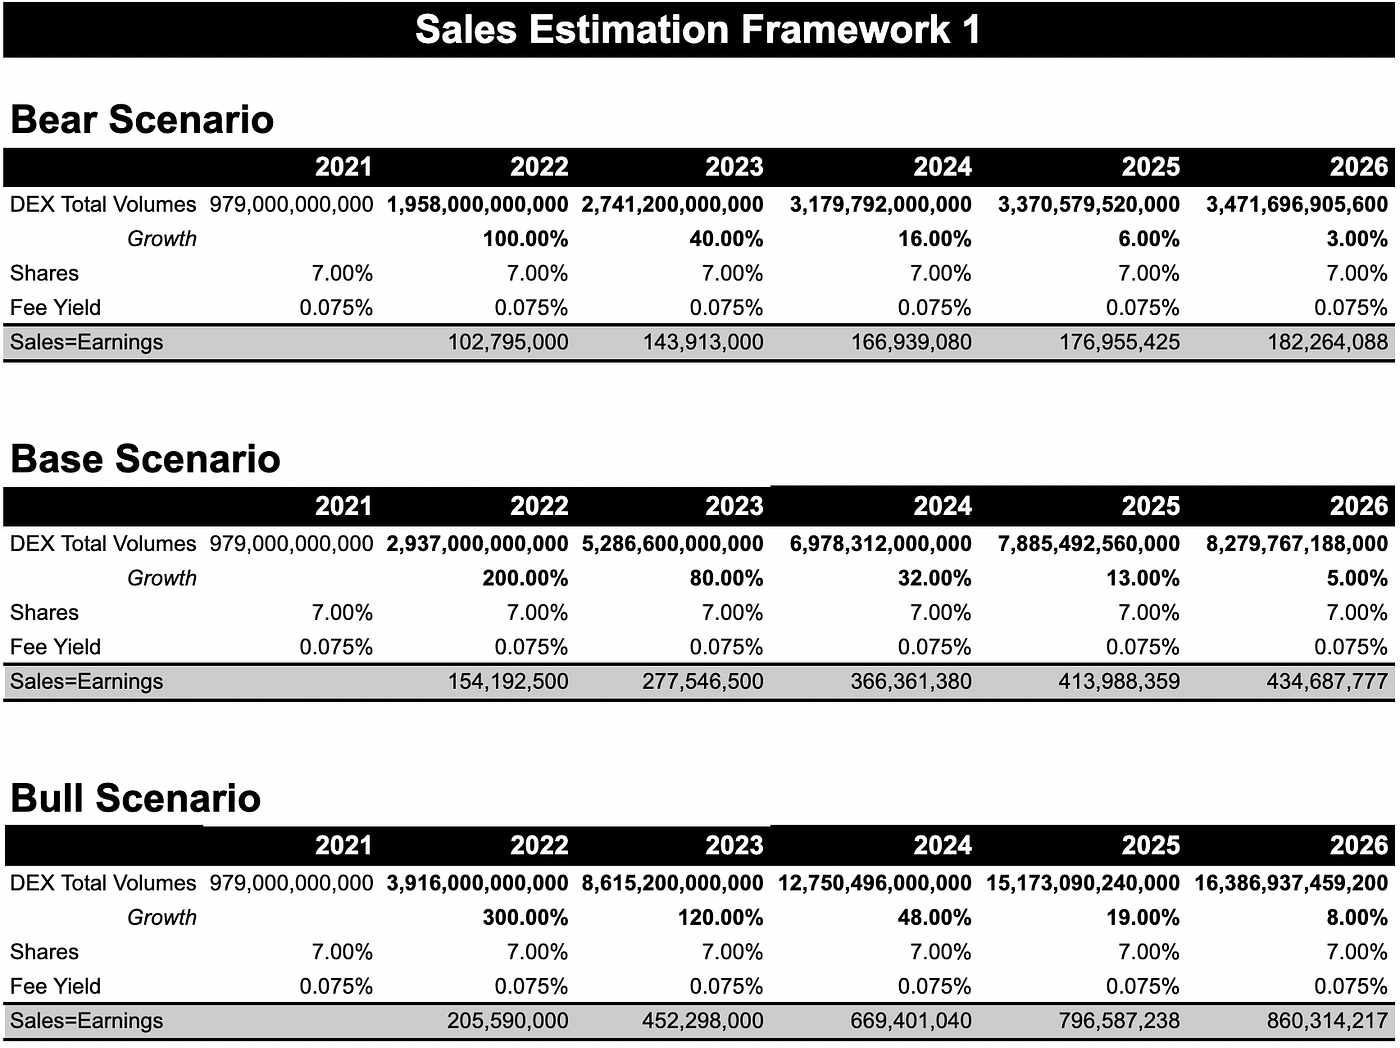
Let us estimate the sales of DYDX using this framework.
- Total volume in DEX in 2021: 979B
- Estimation period: 5 years (2022–2026)
- Market share of DYDX as of current date Marcy 11, 2022: 7% fixed rate
- Yield from the fee: 0.075% fixed rate
• Bull scenario: volume growth by 300% in 2022 and the growth decrease by 2.5 times annually afterwards
• Base scenario: volume growth by 200% in 2022 and the growth decrease by 2.5 times annually afterwards
• Bear scenario: volume growth by 100% in 2022 and the growth decrease by 2.5 times annually afterwards
I will display the above information into numbers using a spreadsheet.
The sheet reflects the above estimates as they are, but it is more important to accumulate experiences of translating one’s view or perspective into numbers rather than taking other person’s perspectives. For instance, you might want to reflect the perspective that says, “In 2021, DEX transaction volume peaked due to the rapid growth of the DeFI market, but in 2022 interest rates will rise and enter a national deleveraging cycle due to austerity phase around the world, so the cryptocurrency market, currently classified as a risky asset, will stagnate and trading volume will decrease. From 2023, I think the market will receive a lot of attention again.” If so, you could set the transaction volume lower in 2022 than in 2021, and then reflect the rapid growth rate again from 2023. The important thing is that you should make continuous efforts of translating your perspectives into numbers.
(2) Sales estimation framework 2
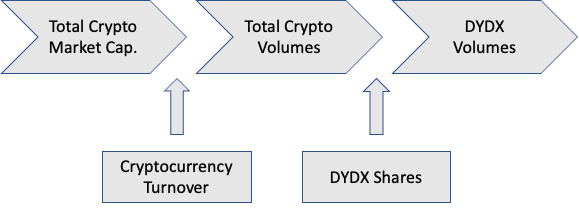
What we want to know is how much transaction volume will occur in DYDX. DYDX currently has a total of 28 tradable products, and it would be very difficult to estimate the future sales of products one by one for bottom-up estimation. Furthermore, it will be difficult to trace products that will be added or removed in the future, and as many products are already being traded, it is easy to think that the total volume of DYDX will eventually increase in proportion to the overall crypto market volume. Therefore, let’s use a top-down estimation to illustrate another framework for example.
- Estimation period: 5 years (2022–2026)
- Total crypto market cap as of Dec. 31, 2021: 2.185 trillion
- Total crypto trading volume in 2021: 15 trillion
- Crypto turnover ratio as of Dec. 31, 2021: 6.86
- DYDX market share: 2%
- Average turnover ratio in the stock market for the past 10 years: 40.21
Currently, trading volume against the market cap is significantly lower than that of the stock market. It is believed that this is because the number of cryptocurrency traders is low, and only a few traders trade in the market. However, it is important to view that as the cryptocurrency market matures, the trading actors will become more diverse, and the turnover ratio would get closer to that of a stock market.
• Bull scenario: turnover ratio reaches 30. The total crypto market cap exponentially grows to reach 40 trillion. => The turnover ratios get closer to that of the stock market. And the market cap reflects the wish of Ray Dalio in 2021
• Base scenario: turnover ratio 20. The total crypto market cap records a CACR of 50%. => Half of the stock market turnover ratio. Grows with the same rate as CAGR for four years between the drastic falls in 2018 and in 2022
• Bear scenario: turnover ratio 7. The total crypto market cap records a CACR of 7%. => No increase in turnover ratio. The growth rate of the total crypto market cap is equated as the growth rate of average S&P 500 in the past
I will display the above information into numbers using a spreadsheet.

No one can predict the future accurately. Using numbers won’t get us find the right answer. This process is about finding out what happens when you express your logical perspective (investment basis) into numbers. Therefore, if the market situation changes or the perspective of the project changes, the number should also be revised. It is recommended that numbers be keyed in the spreadsheet, but all values be organically linked through formulas so that they can be automatically reflected when the input values change.
2. Determining the discount rate
In the previous episode, I introduced the discount rate for curve finance as 20% and the discount rate for Maker Dao as 25%, but it depends on your own choice.
There are many textbook methods to calculate discount rates in the traditional stock/bond market, but those methods are still lacking in historical data and are still difficult to apply to the cryptocurrency market which is still in early stage. Setting the “Required rate of return” according to your perspective would be the most appropriate to match the discount rate with the corresponding result.
Venture capital which invests in startups with a high risk of investment failure, uses a discount rate ranging from 30% to 70%.
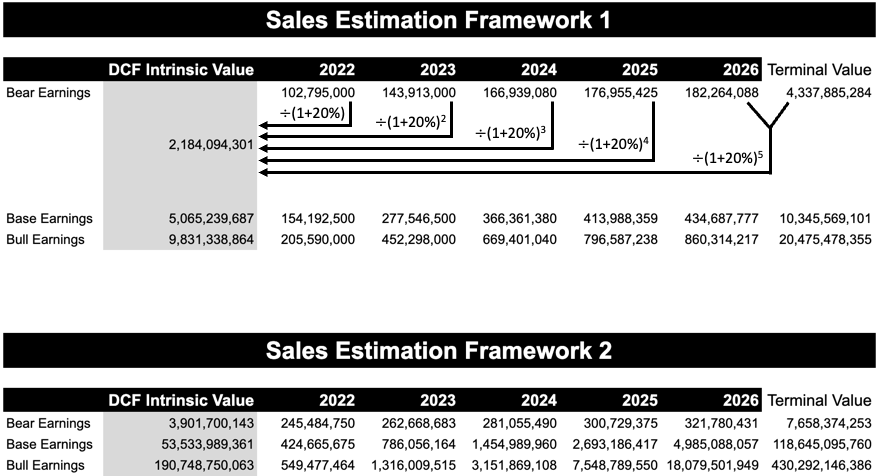
In this episode, I will use three different discount rates of 20%, 30% and 40%.
3. Calculating terminal value
The terminal value refers to expressing the value after the estimation period (~2026) into a single number. There are two ways to calculate.
(1) Estimating perpetual growth rate
Earnings in the distant future after the appropriate estimation period will be difficult to estimate, and it won’t mean much because the resulting numbers will be too vague. One of the traditional ways is to view that the project would have perpetual annual growth of g% under the assumption that it will last forever, and so use infinite geometric series to aggregate all earnings discounted after 2027 to express as a single value (the same as DCF principle).

The 2027 earnings can be calculated by applying the permanent growth rate to the 2026 earnings, and the terminal value refers to values that are earnings that grow by annual perpetual growth rate in 2027, 2028, 2029 and onwards, discounted with the discount rate, and summed infinitely. Summing all values will calculate the terminal value as of 2026. These calculations can be expressed simply by dividing 2027 earnings by (discount rate-growth rate) using infinite geometric series.
Discounted rates set between 20~40%, what would be the appropriate perpetual growth rate?
20%? 10%?
Global GDP growth has fluctuated between 3% and 6% in recent years. However, if DYDX’s perpetual growth rate is set above that, it will lead to unlikely errored assumption that DYDX will one day alone surpass global GDP and cause all the money in the world to flock to DYDX. Therefore, a growth rate below that should be used, but if the discount rate and the perpetual growth rate differ too much, the terminal value calculated will be too small, making it impossible to get valuation properly. Unfortunately, it is still too early to apply the perpetual growth rate method to the cryptocurrency market.
(2) A method to use target PER
There is an alternative to calculating the value after 2027. By setting the target PER for 2026 and multiplying the PER by the earnings of 2026, we can obtain the fair value for 2026. Below is the fair value in 2026 expressed differently.
“Value that has summed all annual earnings discounted since 2027”
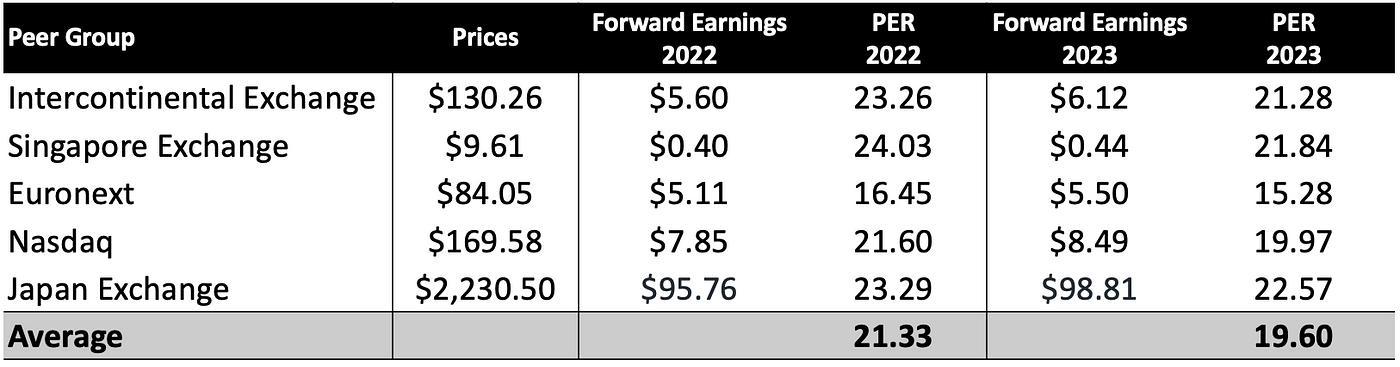
In other words, it is easy to obtain terminal value. Instead, it is important to set the target PER. Here, I would assume conservatively that the cryptocurrency market matures in five years and that it will not show clear growth potential. If so, several peer groups in the traditional stock market that are comparable to DYDX can be found.
Forward PER of peer group in 2022
*1. Intercontinental Exchange: 23.04 (stock exchange)
- NASDAQ: 22.43 (stock exchange)
- Coinbase: 25.92 (centralized coin exchange that is listed)*
The peer group currently shows an average PER of 23.8, and it can be logical enough to assume that PER in the cryptocurrency market, assuming that DYDX will also enter maturity in 2026, will converge at 23.8.
The DCF fair value currently calculated is the earnings earned by the entire DYDX, so it is the concept of appropriate market capitalization, including all issued DYDX token prices. Therefore, if you divide it by the number of coins issued, you can get the fair value per each token.
DYDX’s token distribution schedule has already been released, and all 1,000,000 units planned in about five years will be distributed. The total circulation amount varies from year to year, but conservatively, we will divide the appropriate market capitalization by 1,000,000,000.
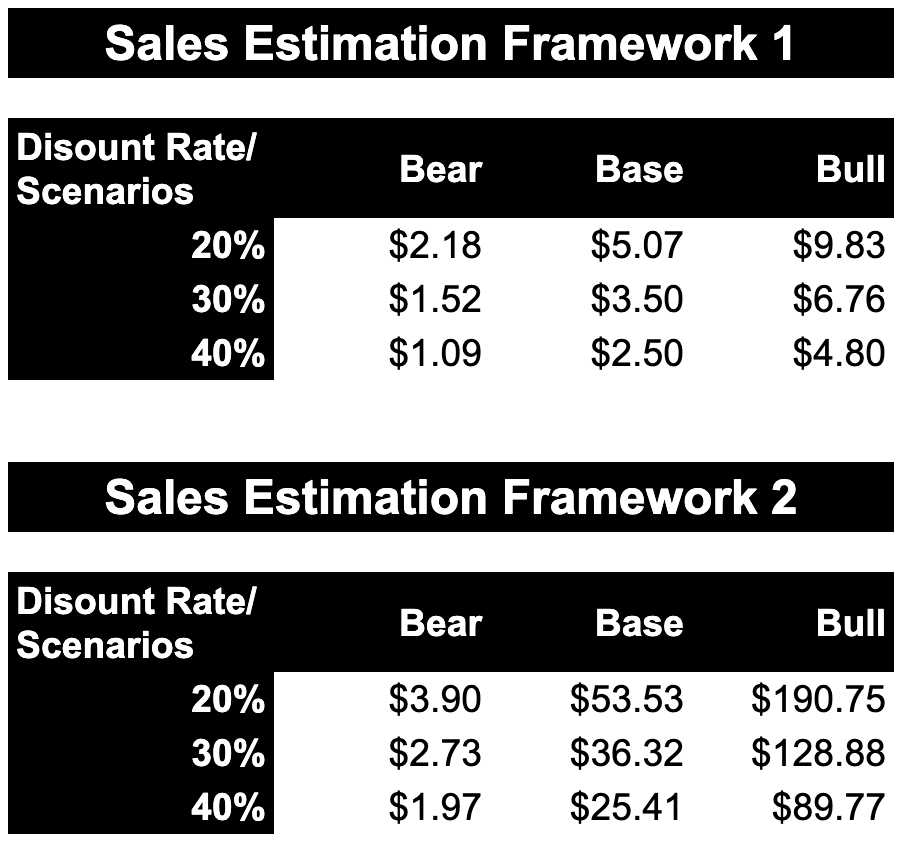
As you can see from the above conclusion, the fair values per each framework/discount rate/scenario vary widely.
There are many reasons for this.
• Discount rate: required rate of return. It means that you would need to buy at the applicable price at minimum if you thought you would get 40% return from the said scenario.
• Estimation scenario: We’ve presented you with different scenarios, but it is up to you to decide which scenario is more reasonable. If you want to reduce the number of numbers a little more, it is also helpful to determine the probability of each scenario occurring and to calculate the weighted average. However, framework 2 shows an excessively wide fair price for each scenario, and these results can make decision-making more ambiguous. This is because the gap between Bull (growth 79% and turnover 30) and Bear (growth 7%, turnover 7) is too large. Of course, both can happen, but market and industry analysis needs to be done more thoroughly to obtain more useful information (numbers) so that it does not create scenarios with extreme scope.
• Framework: There is no correct answer to the sales estimation framework. The best framework is the one that could reflect one’s perspective in the most logical and reasonable way. However, it is recommended to use a multi-faceted framework to avoid making an overly biased estimation.
Relative valuation
Relative valuation is the process of finding fair value by comparing the price of other similar assets (peer group) with the price of the analysis target. Compared to the peer group, you can find undervalued investment assets by discovering relatively cheap assets even though there is nothing wrong with fundamentals.
Relative valuation is proceeded as follows.
• Determining the evaluation ratios
• Calculating ratios to evaluate peer group
• Estimating analysis target earnings, etc. and determining Growth Adjustment Factor
1. Determining the evaluation ratios to be used
The most exemplary indicators currently available for relative valuation are Price to Earnings Ratio (PER) and Price to Sales Ratio (PSR). These are the indicators that can be the most easily and strongly used to judge whether a project generates earnings or sales.
Currently, there are many assets in the cryptocurrency market that have not yet made sales and earnings, or that do not generate earnings at all. Because these assets are driven by the power of communities and developers and a variety of qualitative narratives, direct value calculations such as DCF or other cost/alternative methods are not appropriate. Therefore, it tends to rely on relative valuation, and a lot of efforts have been made in recent years to apply relative valuation to assets without a clear sales and earnings structure. For example, cryptocurrency market-specific indicators such as how to compare the narratives of the community and the value of the network according to the amount of transactions are presented, and it is also very good to create your own ratio.
In this episode, we will talk about the most basic PER using DYDX, however, the principle of all relative valuations is the same.
“Price or market cap” information in the numerator
“The power of the asset” information in the denominator
In the case of PER, the relative price is calculated compared to other assets by expressing the power of the asset using the indicator of earnings. The principle of relative valuation is all the same, so knowing how to use PER, any indicator can be used anytime.
2. Calculating indicators to evaluate a peer group
Peer group refers to those to be compared for relative valuation In this episode, from a conservative perspective, we will set up peer groups as traditional stock exchanges across continents around the world and assume that DYDX will converge to the stock exchange PER over time. Depending on your perspective, you may set up other DEX in the crypto market as a peer group.
3. Estimating denominator of target asset and determining Growth Adjustment Factor
In this episode, PER is used as an evaluation index, so the denominator information is “earning.” In the case of PSR, the denominator is “sales”.
Relative valuation results in the format of “the target price in year xx: yy”.
For instance, the target market cap of DYDX 2022 can be calculated by multiplying the estimated earnings of DYDX in 2022 with the PER of the peer group in 2022. Please note that the denominator information of the analysis target and evaluation indicator of peer group should have the same timing.
However, before calculating the target market cap, there is the last thing to be checked. If DYDX’s future growth strength is significantly different from peer groups, using PER of the peer group as it is will result in an overly conservative value. Just as the PER of high growth stocks is significantly higher than PER of value stocks, evaluation indicators with premium should be applied to projects with high growth potential. The growth adjustment factor is determined in order to apply such premium.
The consensus earnings growth rate of the stock exchanges set as peer groups averaged only about 8 percent. If the earnings growth rate of the analysis target will grow twice as fast as the peer group, the growth adjustment factor becomes 2, and the PER of the peer group will be multiplied by 2 to calculate the target price.
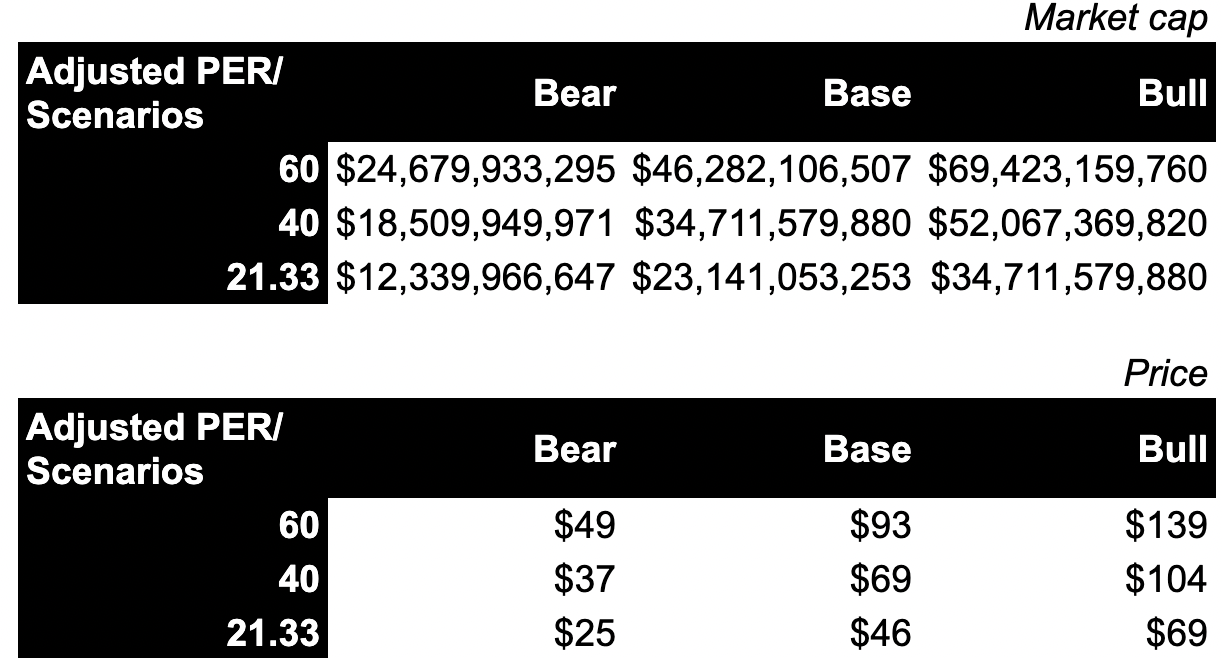
Below is the DYDX relative valuation.
- Analysis target: token price as of DYDX in the late 2022 DYDX
- Evaluation indicator: PER
- Estimated earnings of DYDX in 2022
• Bull scenario: $1,157,052,663 => The trading volume in 2022 is eight times the total trading volume of Q4 2021
• Base scenario: $867,789,497 => The trading volume in 2022 is six times the total trading volume of Q4 2021
• Base scenario: $578,526,331 => The trading volume in 2022 is four times the total trading volume of Q4 2021
- PER of peer group in 2022: 21.33
- Growth adjusted PER: 21.33,40, 60
- Estimated DYDX token circulation in 2022: 500,000,000
It is always important to keep in mind that these results are calculated by a variety of assumptions that reflect your perspective. You need to make check whether your perspective is wrong or not, whether you have entered numbers that can reflect your perspective as much as possible, and whether the market and industry situation have not changed.
Also, you can check the validity of your perspective by looking at the result value. For instance, to see that $25 is the fair value of DYDX’s token, you should be able to agree to the following that “Trading volume of DYDX in 2022 can continue to be the same as the volume achieved in the fourth quarter of 2021 and can be evaluated as much as the average PER of the stock exchange.”
Of course, the market is always irregular, and not all fundamental information is always reflected in the market price simultaneously. However, as an investor, you would always have a basis for your investment. If you continue to practice expressing the basis into numbers, unless you’ve found errors in your investment perspective, you won’t need to be sad and happy due to market inefficiency and pursue panic trading, but you could rather actively seek opportunities for additional purchase and earnings realization. In addition, it is easy to set the fair value based on a new perspective by varying the input value during error detection and situation fluctuations.
Lastly,
Investment is a lifelong task. And each of you would have your own investment method and philosophy. Valuation is one of many ways to create a basis for investment decisions, but it is for sure a powerful tool which can help you upgrade your way of making investment in a well-organized manner. Why don’t you use these tools to build a more robust investment philosophy?
DeSpread — Website | Twitter | Telegram | Facebook
DeSpread is a multi-chain ecosystem builders founded by blockchain content creators to help projects to accelerate together with the sustainable ecosystem. Our mission is to establish strong ecosystem foundation for anyone through eye-to-eye communication and education.