
It’s has been volatile for the DeFi world. First, the storm of war has been raging for two weeks, injecting uncertainty and lashing the already downturned market of 2022. Next, President Biden of the United States will sign the executive order to outline the U.S. government’s strategy for cryptocurrencies, including examining potential regulatory changes and the national security and economic impact of digital assets. Meanwhile, the banning of Russian oil importation will push the electricity price, thus hitting the crypto space.
Even though it is likely that more bad news is coming down the pipe, we still, and we should be the prisoner of hope. For example, we have seen that Ukraine crypto donations pour in after the Russian invasion. And large institutions like ARK Investment Management and Morgan Stanley have been buying Grayscale Bitcoin Trust shares in the market. Not to mention that one of the best economics podcasts — NPR’s Indicator just produced an episode articulating that Cryptocurrency is reaching the status of a safe haven.
After all, we have already put our wishes upon the star that we have faith in #ToTheMoon.
Now let’s get to the arbitrage data of last week to see how #MEV has been doing recently. Without proper tools, it’s perplexing to grab the big picture and decode the details of arbitrage transactions. This weekly report, and EigenPhi’s mission, is to reverse-engineering the mystery. Also, some gripping reverses were happening last week.
The Unexpected Reverse
The worrying trend manifests in EigenPhi’s arbitrage transaction data. Here are the last six weeks’ BSC and Ethereum weekly profit summaries.
Last six weeks’ BSC and Ethereum weekly profit summaries of arbitrage
In six weeks, Ethereum’s arbitrage profit shrunk from over $80.3 million to less than $1.8 million, only 2.2% of the former. However, contrary to Ethereum, BSC was faring well. Although the gross profit of arbitrage on BSC had been just over $9 million, it had not dwindled that fast. Even on Week 8 of 2020, BSC’s arbitrage profit had exceeded Ethereum and sustained as such in Week 9.
It’s time to dive into the data of last week.
One Pareto, Two Paths
The table below exhibits the summary of weekly and top 10 arbitrage contracts on volume and frequency covering BSC and Ethereum.
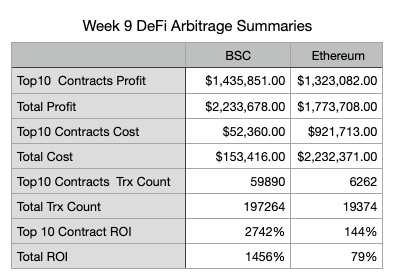
It’s already startling that BSC has a more significant profit. We are even much more being taken back by BSC’s 20 folds ROI of Ethereum. As to the transaction counts, BSC has almost tenfolds of Ethereum.
Processing the amount to percentage, and here is the result.
On BSC and Ethereum, the Top 10 contracts profit is much more than the rest. However, relatively speaking, the cost and frequency of the Top 10 are both less than half. The Pareto principle, aka the 80/20 rule, applies here in an implicit way, which illustrates explicitly in the chart below examining the average profit and cost per transaction and median profit and cost.
Based on the chart, the mean profit of Ethereum is about 30x of median gain, which the Arbitrage Transaction Profit Distribution table can explain on https://eigenphi.io/. The picture below is the data of today, Mar 9th of 2022. The time period is set to 7 days.
It shows that 95%’s transactions’ profit is less or equal to $216.60, but the highest profit of a single transaction is $267,145.67. BSC’s arbitrages had the same problem yet less severe.
We can also conclude that the cost of arbitrage on BSC is relatively flat. After all, the difference between the mean and median is pretty tiny. Nonetheless, Ethereum’s mean cost triples the median.
Myriads of transactions on BSC pulled down the profit amount of transactions. To further study the profits and frequency in chronological order, we can break down the data.
Another Reverse
Two charts below split the profit and frequency. Please note that both charts’ right axes indicate transaction counts but different scales.
It’s easy to identify that the arbitrages on Ethereum had been fluctuating vis-a-vis the relatively stable transaction frequencies. But, on the contrary, BSC’s MEV profits had the same trend as the transaction count.
The chart below reveals the courses more clearly. It exhibits the average profit per transaction of the two chains day by day. We can deduce that the Ethereum arbitrage is more turbulent than BSC.
Another intriguing reverse emerged from the upper two charts. In general, as time goes by, the profit curve of Ethereum is going up against the declining BSC. As to the reason, we are crunching more data to get to the bottom of it. And we will share it with the community as soon as we have it.
The chart below compares the profitability by frequency of the two chains. Reading the two fitting lines, we can tell that launching more transactions to make more money is substantially easier on Ethereum.
Sandwich Is Not the Easiest Food, Even For the Big Guys.
Let’s move on to what the top 10 whale contracts did and how they did it. First, we split the top 10 contracts’ volume on both chains by the arbitrage type: combination, sandwich, spatial, and triangular. Here is what we’ve got:
- Spatial arbitrage is still the most profitable thing in terms of ROI AND amount of profit. On BSC, the Combination arbitrage has been outstanding, resulting from a low Gas fee leading to far more liquidity pools and more tokens on BSC.
- Although Sandwich arbitrage has always been the industry’s focus, it is not easy to swallow. On Ethereum, flashbots enables a more stable and higher success rate of arbitrage. (We had a piece guiding you through a sandwich deal.) Still, you need to invest a lot for a good harvest with an ROI a little better than 38%. On BSC, it’s fair to say that Sandwich is not on the main menu for the lacking of mechanisms like the flashbots.
After revisiting the bigger picture, we have something special about sharing some special transactions.
One/More Transactions
When you probe Arbitrage Transaction Profit Leader Board on https://eigenphi.io/, you can not miss these transactions marked by the red rectangle:
How come these transactions that belong to the same contract can skyrocket their gains with so few costs? After some thorough investigation, our data analysis team concludes that these are the MIM-UST arbitrages based on Abracadabra Degenbox Strategies. You can read the deeper analysis by Crypto Risk Assessments. An “unsuspicious” brief intro by Abracadabra.Money, the team behind the strategy, might be helpful too.
DeFi is Full of Surprises.
OK, that’s it for week 9 of 2022. So many things are still happening. If there is only one thing for sure in the DeFi world, IT IS NEVER DULL.
P.S.: we just released the Liquidity Pool detail page feature on https://eigenphi.io/. Now the trinity has formed: contracts, liquidity pools, and transactions. Please feel free to roam around in the structures exposed by us. Frequently Used Pools would be a great start.
Follow us via these to dig more hidden wisdom of DeFi: