
Nov. 2022, Vincy
There are countless no-code analytics tools on the market today, allowing developers and non-developers alike to build charts and dashboards using a drag-and-drop approach.
This list goes over 4 no-code data analysis tools for different use cases and industries. These tools can save time and help users make informed decisions based on the data.
1. Footprint Analytics
Footprint Analytics is a one-stop platform for on-chain data analysis for GameFi, DeFi, and NFTs. It helps developers, analysts, and investors get actionable metrics from on-chain data.
In the past, this kind of data required a lot of developer resources to index and organize. Now, it only takes a few minutes to realize multi-sector data analysis of the blockchain.
Use case:
On the Footprint Analytics homepage, users can click “Create” to create different charts and dashboards to continuously track the behavioral activities of more domain indicators.
- Drag and drop to create data tables or dashboards
The platform provides an interface to the wash trade API filter, which allows developers and traders to filter suspicious trades from the trade and obtain accurate trade data to analyze the organic market without having to write code.
In addition, more data indicators are included, such as comparison of NFT projects, overall performance of the GameFi market, and an analysis of the situation of each chain.


Dashboard — Wash Trading Overview
- Any platform is supported to display the data of head collections on the website. Select the indicator you need, and simply embed the code into your website. See the example of embedding operation for details.

- Data APIs can be called directly, linking any technology stack to the blockchain network. To learn more about the Footprint Analytics Data API, you can click this document to view it.
2. Code2
Code2 lets you build responsive, full-featured customer-facing web applications without code. It can be content to visualize your data on dashboards and pages. Turn your data into meaningful business metrics, comprehensive reports, or applications.
Use case:
The drag-and-drop interface allows you to create scalable web apps with pixelated designs and workflows.
- Use Code2’s NiftyExpo template to display NFT collections, allowing users to create pixel login pages for their OpenSea collections.


- Unlike Footprint Analytics, Code2 requires you to add your own data to the database in order to create the corresponding data model.

Data Dashboard
3. Mixpanel
Mixpanel is a tool that collects and analyzes customer data. Users get event analysis, funnels, retention and return visits, the dimensions.
The platform also has an API with its own set of query language to take all the analysis results and also to download raw data.
Use case:
- Use Mixpanel to automatically segment customer experience funnels by each available attribute to identify user groups that contribute to increased conversions (positive or negative).

- Two-way integration with partners
Timing and targeting are crucial for marketing. Mixpanel can be used in conjunction with Airship , Iterable , OneSignal leading messaging tools to send in-app messages to users at key moments.
For example, you can choose to encourage highly engaged users to rate the app as a result of completing specific actions
- Reports can be shared with your team using our Slack integration
When you place a Mixpanel “short link” in Slack, it will allow you to preview the report directly, so that even users without a platform account will be able to see the preview. This works for funnel and retention reports.

Short link displayed on Slack
4. Dataiku
Dataiku is a code-free “platform for AI application design, deployment and management.” Using this tool, you can take control of every step towards real-world AI applications by:
- Data pre-processing and visualization
- Machine learning model design, training, testing and validation
- Data manipulation and MLops
- Analytics applications
Dataiku allows anyone to use it and with data-driven decisions can take your business to the next level.
Use case:
- Compare data models
Champions and Challenger Model evaluation is a well-known method for comparing model performance in-production. Users can also track model performance by calculating performance metrics and data drift scores to see the differences between champion and challenger models.

In this evaluation shop, we can also create model comparisons to get granular performance charts out-of-the-box.

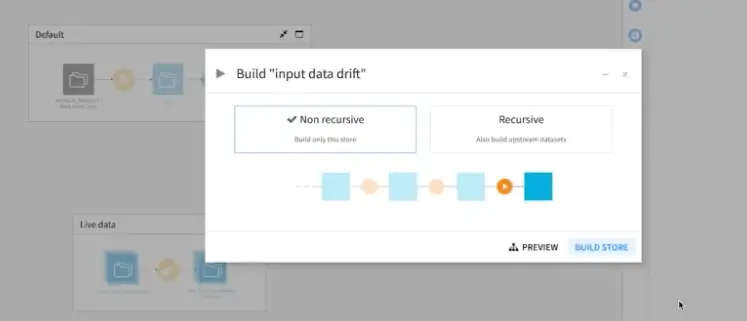
- Automatic input data offset detection
After deploying the model, using the API audit log in Dataiku, you can receive all the data that the model will score in-production in real-time. In addition, you can track changes to the data generated by the model. To check that the live data is the same as the data from the training model, you can use a simple evaluation method which allows you to identify and measure data drift.
Summary
No-code tools are becoming more popular across various industries and use cases, from blockchain to customer data analytics. There is endless data, but hardly enough teams and organizations harness it to make better decisions. These tools can save time and help them do so.